33 questions
No question matches your search.
Frequently asked questions
Are there more earthquakes today than in the past?
There do not objectively seem to be more earthquakes, or more large earthquakes, today than in the past. The opposite impression comes from several factors:
- The network of seismic stations is now very dense worldwide. It locates very small earthquakes that used to go unnoticed.
- The population is growing: large earthquakes affect more people and cause more damage.
- Modern media spread news of an earthquake very quickly, even when it has caused no casualties.
Even though several earthquakes with a magnitude greater than 7.0 have been recorded in recent years, this is a normal variation: it does not mean that there will be more and more of them.
For worldwide statistics, see the USGS pages:
Can earthquakes be predicted?
Even today, it is impossible to predict a large earthquake. We know the so-called “high-risk” areas, but we cannot determine the exact place and time of an earthquake. Some signs, such as animal behaviour, have occasionally allowed local populations to take shelter; but earthquakes have also occurred without any unusual animal behaviour beforehand. Earthquakes remain a destructive natural phenomenon: the only way to protect oneself is to build resistant infrastructure and to teach everyone how to react in an earthquake.
GPS measurements of the relative motion of tectonic plates, knowledge of subduction zones and active faults, and the study of seismicity and of the return period of earthquakes in a region make it possible to estimate the seismic hazard. The moment a fault ruptures, however, cannot be predicted precisely enough to evacuate the population.
For more information, see the USGS pages:
- Can you predict earthquakes?
- Can we predict earthquakes? (audio recording)
How are earthquakes located?
There are two basic methods for locating an earthquake: the circle method and the hyperbola method.
The circle method
This method assumes that seismic waves travel in a straight line from the focus to the stations. This is not exact, but it is enough for a first estimate of the earthquake’s position. Since the velocities of P and S waves are known (see Seismic waves), the time difference between their arrivals on a seismogram gives the distance between the station and the focus.
If _T_₀ is the origin time and d the distance:
Subtracting these two equations gives:
With the arrival-time differences at three stations, the distance from the earthquake to each of them is known. A circle of radius d is drawn around each station: the intersection of the circles gives the position of the epicentre. For a deep earthquake, spheres must be drawn instead, and their intersection gives the position of the focus. The difficulty with this method is that the arrival of the S wave is not always easy to pick on a seismogram, especially for small earthquakes.
The hyperbola method
This method is similar to the first but uses only the arrival times of the P wave. At two stations A and B:
Subtracting these equations gives:
This equation describes a hyperbola with stations A and B as its foci: the epicentre lies on this hyperbola. Doing the same with a third station C gives three hyperbolas that intersect at one point: the epicentre of the earthquake.
Modern methods
Today, thanks to advances in computing, iterative methods compute the parameters of an earthquake (coordinates, depth and origin time) while keeping the uncertainties as small as possible. They are still based on the principle of circles and hyperbolas.
How many earthquakes are there on average per year in Belgium?
The number of earthquakes above a given magnitude decreases logarithmically with magnitude, following the Gutenberg-Richter relation:
where:
- N: annual number of earthquakes with a magnitude greater than M;
- M: magnitude;
- a, b: constants.
b is usually close to 1, which means that earthquakes with a magnitude greater than M are ten times less frequent than those with a magnitude greater than M − 1.
Worldwide, the annual average per magnitude class, computed by the USGS from observations since 1900, is:
| Magnitude | Earthquakes per year |
|---|---|
| ≥ 8 | 1 |
| 7 – 7.9 | 17 |
| 6 – 6.9 | 134 |
| 5 – 5.9 | 1,319 |
For Belgium and the border regions, the earthquake catalogue of the Royal Observatory of Belgium gives the following relation:
as shown in this graph:
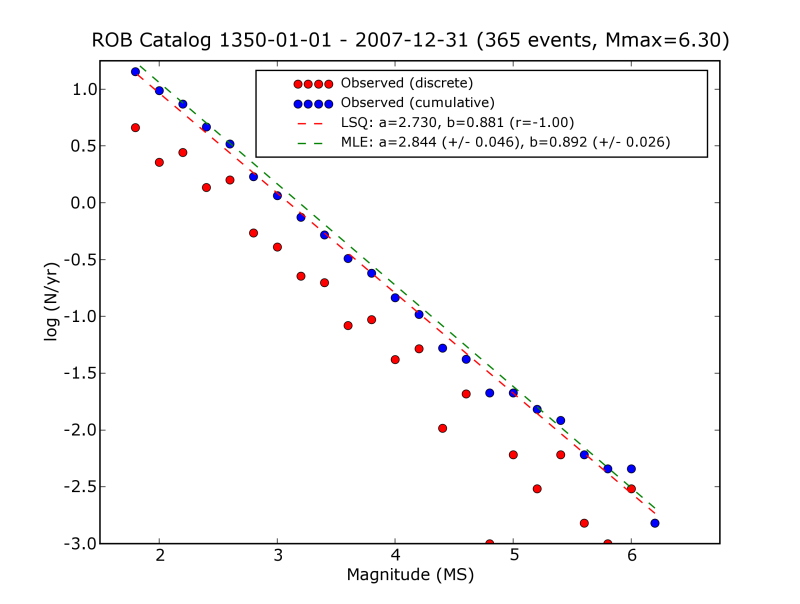
In Belgium, the average number of earthquakes is therefore:
| Magnitude | Number of earthquakes |
|---|---|
| ≥ 6 | 1 every 315 years |
| ≥ 5 | 1 every 40 years |
| ≥ 4 | 1 every 5 years |
| ≥ 3 | 1.5 per year |
| ≥ 2 | 11 per year |
Many smaller earthquakes also occur without being felt by the population; the instruments record them nonetheless.
I felt vibrations: was it an earthquake?
The seismology service of the Royal Observatory of Belgium is regularly contacted by people who have felt vibrations and wonder whether they were caused by an earthquake. A single isolated report, however, rarely corresponds to a real earthquake. Earthquakes occur at a relatively great depth: in Belgium, usually between 2 and 25 km. At such depths the attenuation of seismic waves is small, so earthquakes of magnitude 2 or more occurring in Belgium are recorded by all the stations of the Belgian seismic network. Smaller earthquakes are rarely felt. Stronger earthquakes at the same depths are felt over a wider area, and therefore by a large number of people.
Most of the calls we receive concern vibrations whose source is at the surface. In the shallow sedimentary layers these vibrations die out quickly: a few kilometres away, seismometers no longer record them. If the vibrations reported to us do not appear at any seismic station, they are not of seismic origin. At the surface, vibrations can have a natural cause, for example wind acting on trees and buildings. Many vibrations are also caused, directly or indirectly, by human activity: heavy-goods traffic, industrial activities, large construction sites, settlement of shallow layers after the water table has been lowered, and sometimes even concerts. Blasting in quarries and mines also causes vibrations that can be felt locally; unlike other surface vibrations, these are recorded by seismometers up to a few tens of kilometres away. To limit disturbance from artificial vibrations, we install our seismometers in quiet places as far as possible, which is not always easy in a country as densely populated as Belgium.
If you felt a vibration that the media are not (yet) talking about, it may still have been a small earthquake. First look at the real-time seismograms of our stations: if disturbances appear at the same time at several stations, it is probably an earthquake. In that case, please fill in our questionnaire “Did you feel an earthquake?”: your answers let us quickly map the effects and any damage caused by the earthquake in Belgium.
I'm going on holiday abroad: should I be afraid of earthquakes?
If the region you are travelling to is covered with red circles on the map in “Where do earthquakes occur?”, you may feel an earthquake during your holiday. That does not mean it will be destructive. If you are going to an active area, however, it can be reassuring for you and those with you to know what to do in an earthquake: see “What should I do in an earthquake?”.
Whatever the country, if you are at the seaside and feel an earthquake, move as far away from the shore as possible and seek refuge on high ground: an earthquake felt on the coast may be followed by a tsunami.
Have a good trip!
Is there always a tsunami?
Tsunamis are large waves generated when large masses of water are set in motion in the oceans, inland seas or sometimes lakes. Several phenomena can cause them:
- large submarine earthquakes;
- large landslides, on the coast or under water;
- volcanic eruptions: the flank of a coastal volcano collapses into the water, or a submarine eruption displaces large masses of water.
Of all these causes, submarine earthquakes are the most frequent source of tsunamis. Not every submarine earthquake, even a large one, causes a tsunami: the slip between the tectonic plates must be at least partly vertical. It is when the ocean floor is uplifted or drops down that it displaces the water and triggers a tsunami. If the motion between the plates is mostly horizontal, there is (almost) no tsunami.
Noise and vibration nuisance
Noise or vibration nuisance caused by human activities falls under the responsibility of the Regions. It can be useful to contact the environment department of your municipality first: it is close to residents and may already have received similar complaints. If that does not help, you can call on an environmental expert. The Regions accredit laboratories and experts, so please consult the website of your Region:
Walloon Region
- Choosing an accredited laboratory or body for noise measurements (wallonie.be, in French)
- Environment portal of Wallonia (in French)
Brussels-Capital Region
Brussels Environment is responsible: it handles noise complaints and can carry out measurements.
Flemish Region
The Environment Department (Departement Omgeving) of the Flemish government is responsible:
- Accredited noise and vibration experts (vlaanderen.be, in Dutch), with the list of accredited experts (PDF).
- There is an environmental inspection service, but in most cases it refers people to the municipal environment officer or to the police.
What are accelerometers for?
The accelerometer network complements the seismic network: it provides data when strong ground motion saturates conventional seismometers. Accelerometer data are very important, not least because they give engineers the ground accelerations that buildings and civil engineering structures undergo during an earthquake.
What are the effects of an earthquake?
The effects of an earthquake can be very diverse and vary from place to place.
From simple ground vibration to changes in the landscape, everything depends on the magnitude of the earthquake, its depth and the distance from the epicentre. The nature of the ground can also amplify the seismic waves locally.
Several phenomena, independently of one another, can threaten lives:
- damage to buildings;
- landslides;
- rupture of the fault up to the surface, which changes the landscape;
- liquefaction of sands.
Submarine earthquakes can also generate tsunamis, which are often far more destructive than the earthquake itself (see “Is there always a tsunami?”).
What if the vibrations I feel are not caused by earthquakes?
Unfortunately, we cannot help you further. The task of the Royal Observatory of Belgium is to record and study the earthquakes that occur in Belgium. Vibrations caused by human activity (works, traffic, blasting, etc.) are not earthquakes and fall outside our field of research; nor are we familiar with the regulations and standards that apply to them. Noise or vibration nuisance caused by human activities falls under the responsibility of the Regions: see “Noise and vibration nuisance”.
What is Eurocode 8?
Eurocode 8 (EN 1998-1) is the European standard for the design of earthquake-resistant structures. It came into force at the beginning of 2011 in all member states of the European Union. It sets out what must be taken into account from the very design of buildings: see the Eurocode 8 page.
What should I do in an earthquake?
Warning
Belgium lies in a so-called stable region, but large earthquakes could, as in the past, cause significant damage here. The general guidelines below apply mainly to high-risk areas; some of them, however, are valid everywhere.
Before
- Prepare basic emergency supplies: battery-powered radio with spare batteries, torch, drinking water, personal documents, essential medicines, blankets, spare clothes.
- Find out from the authorities about the risks and the safety instructions.
- Organise the group you are responsible for; discuss with your family what to do in a disaster (protection, evacuation, meeting points).
- Take part in drills, or follow them, and learn from them.
- Find out where to shut off gas, water and electricity.
- Secure heavy appliances and furniture.
- Agree on a plan for reuniting the family.
During
- Stay informed: listen to the radio for the first instructions.
- Inform the group you are responsible for.
- Do not go to collect children from school.
- Stay where you are:
- indoors: get close to a load-bearing wall or column, or under sturdy furniture, and keep away from windows;
- outdoors: do not stay under power lines or anything that might collapse (bridges, cornices, roofs…);
- in a car: stop and do not get out until the shaking is over.
- Protect your head with your arms.
- Do not light any flame.
After
- Stay informed: listen to and follow the instructions given on the radio and by the authorities.
- Report any danger you notice to the authorities.
- Give first aid to your neighbours; think of elderly and disabled people.
- Make yourself available to the emergency services.
- Do not use the telephone except in an absolute emergency.
- Assess the damage and the dangerous spots, and keep away from them.
- Beware of aftershocks: further shocks may follow the first one.
- Do not use lifts to leave a building.
- Check gas, water and electricity: in case of a leak, turn off the supply, open doors and windows, get out and alert the authorities.
- Keep away from the coast, even long after the shaking has stopped, because of possible tsunamis.
Find out more
Advice from the USGS:
Where do earthquakes occur?
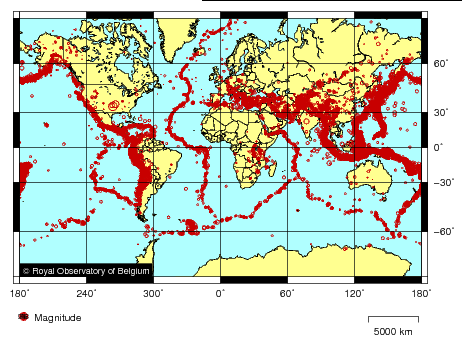
On a world map, earthquakes outline a jigsaw puzzle whose pieces are the tectonic plates. Earthquakes at plate boundaries are called “interplate” earthquakes: they are by far the most numerous. Others occur within the plates themselves: these “intraplate” earthquakes are much less frequent but can also be destructive.
On the following map, the red circles show the earthquakes with a magnitude greater than 5.0 that occurred worldwide between 1 January 2000 and 31 December 2010.
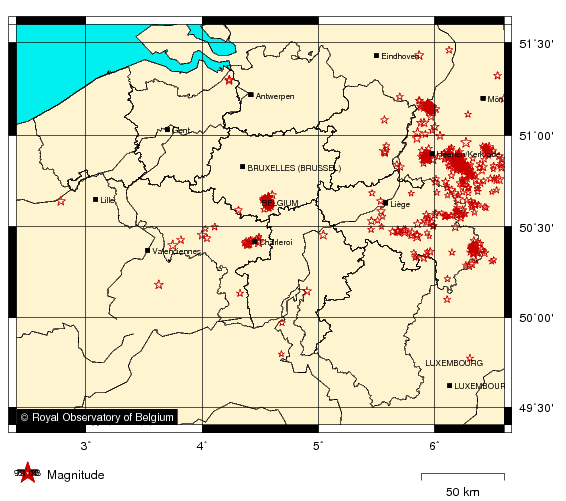
Belgium has earthquakes too. The following map shows those that occurred between 1 January 2000 and 31 December 2010.
An earthquake can be felt, and cause damage, more than 200 km from its focus. How strong the shaking and the damage are depends on the magnitude and depth of the earthquake.
To understand where, why, when and how earthquakes occur in a region, one has to know its tectonic setting, that is, the structure of the Earth’s crust and the deformation it undergoes. The study of the link between seismic activity and tectonics is called seismotectonics: see Belgian seismotectonics.
Glossary
Fault
A fault is a fracture in the Earth’s crust along which the two blocks move relative to each other. This relative motion can take several forms: depending on how the blocks on either side of the fault move, we speak of a normal fault, a reverse fault or a strike-slip fault.
A simple animation often says more: see the IRIS animations.
g
The acceleration due to gravity, g, is the acceleration that all bodies undergo at the Earth’s surface: it is what makes the apple fall from the tree, pulled towards the ground by the force of gravity
where m is the mass of the object.
Mathematically, g is expressed as:
where:
- G is the universal gravitational constant, 6.674 30 × 10−11 m³·kg−1·s−2 (CODATA 2022 value);
- ME is the mass of the Earth;
- R is the radius of the Earth.
The value of 9.81 m/s² is a commonly accepted average, but g varies in space (among other reasons because the Earth is not a perfect sphere and rotates on its axis) and in time (the motions of the Moon and the Sun also affect g). See also “What is gravity?”.
Intensity
Before the first seismographs came into service at the end of the 19th century, the only information available about earthquakes was how witnesses had felt the ground shaking and what damage had been caused.
The need to classify earthquakes by their importance led to the concept of intensity: a measure, at a given place, of the effects of an earthquake on people, their natural environment and their buildings. The first widely used intensity scale was that of the Italian Mercalli (1902). It has twelve degrees, written in Roman numerals, from I (not felt) to XII (total destruction).
Other intensity scales were derived from it, each with its own criteria for distinguishing the degrees. In Europe, the most widely used scale was long the MSK scale, drawn up in 1964 by Medvedev, Sponheuer and Kárník; it has been replaced by the European Macroseismic Scale EMS-98.
Unlike magnitude, intensity depends on the place of observation. It generally decreases with distance from the seismic source, which for large earthquakes can extend far from the epicentre. The intensity in the epicentral area is written I0. Intensity can, however, increase locally when thick layers of loose sediment amplify the shaking (the “site effect”).
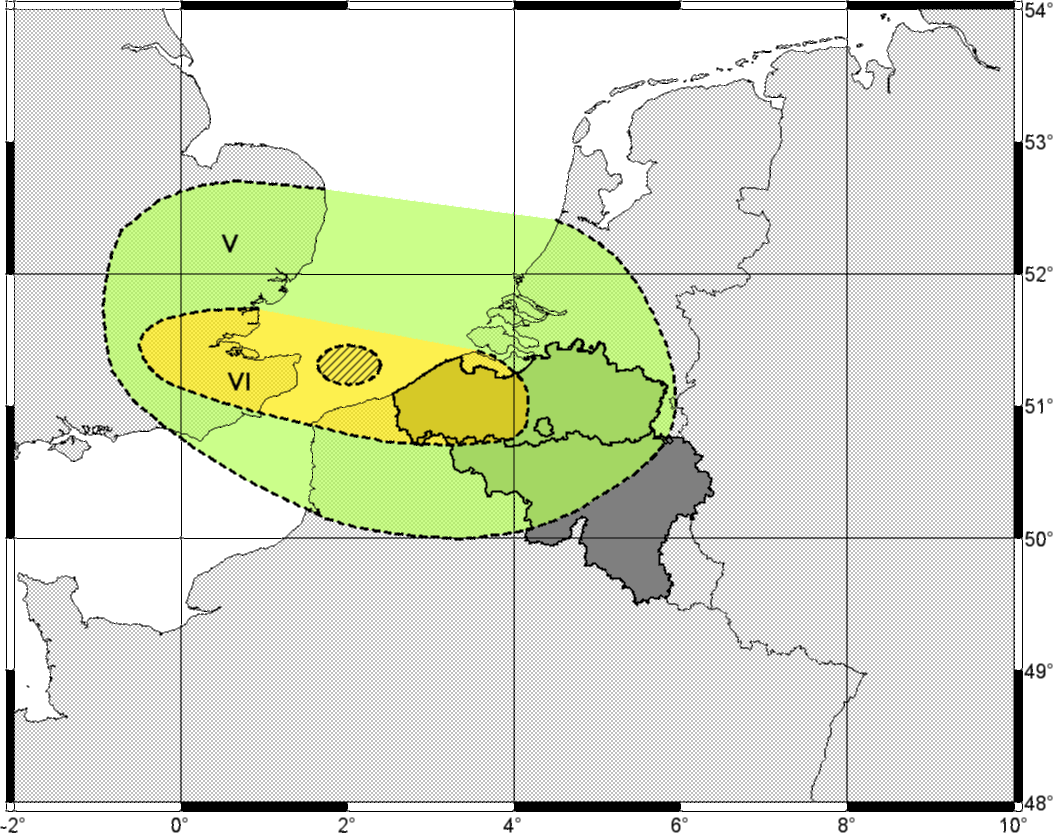
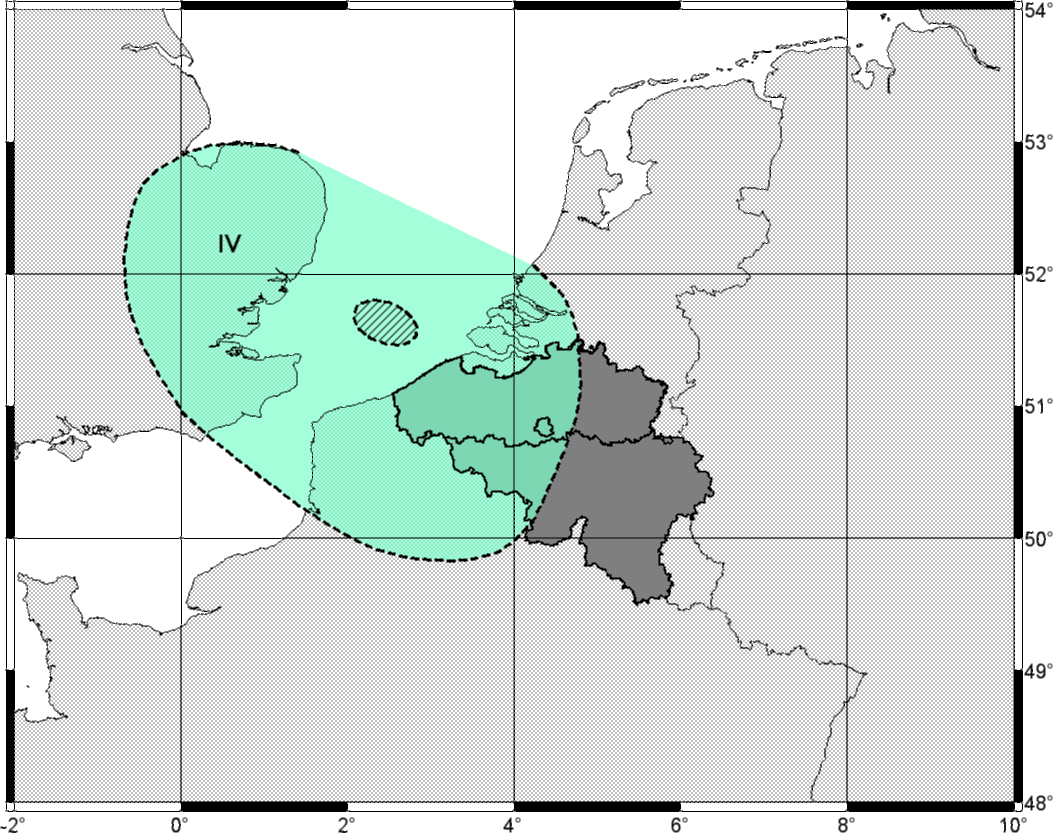
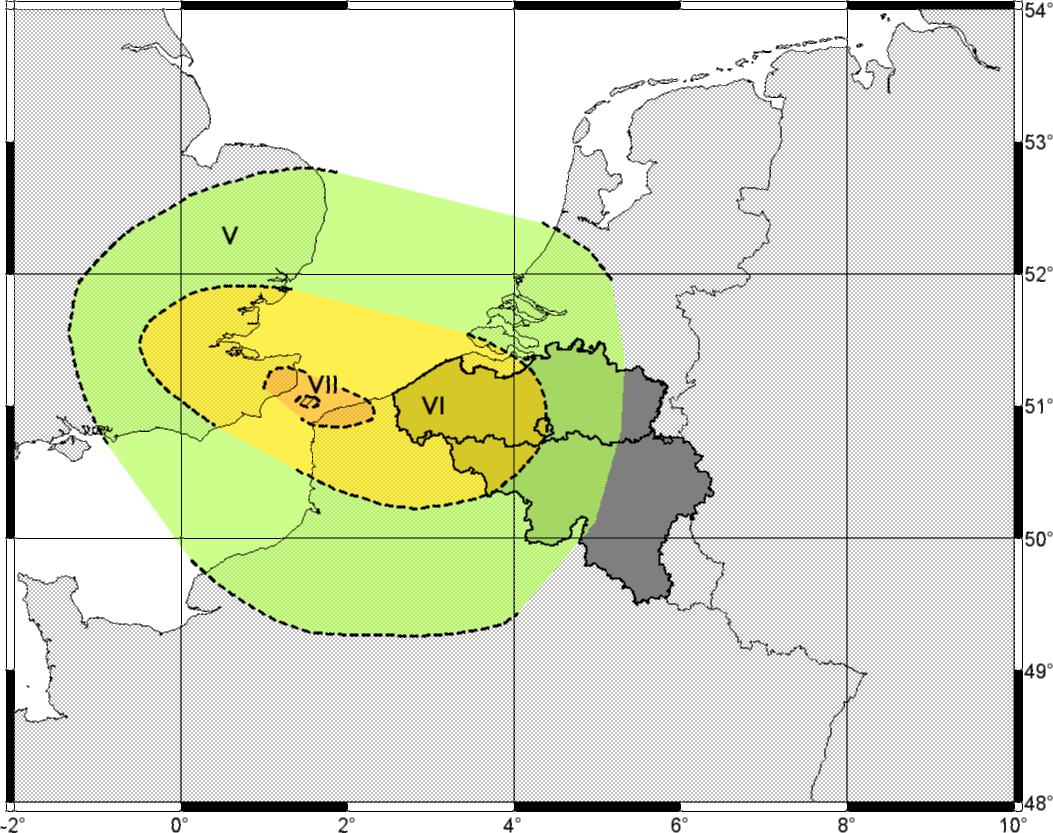
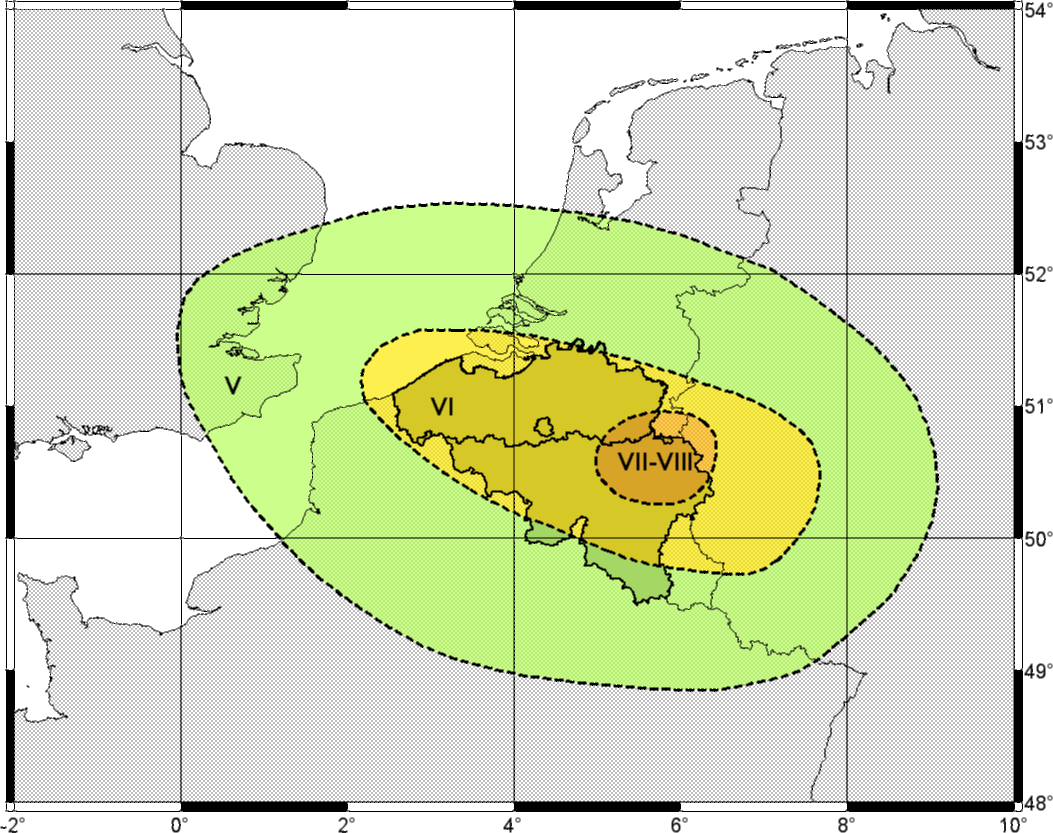
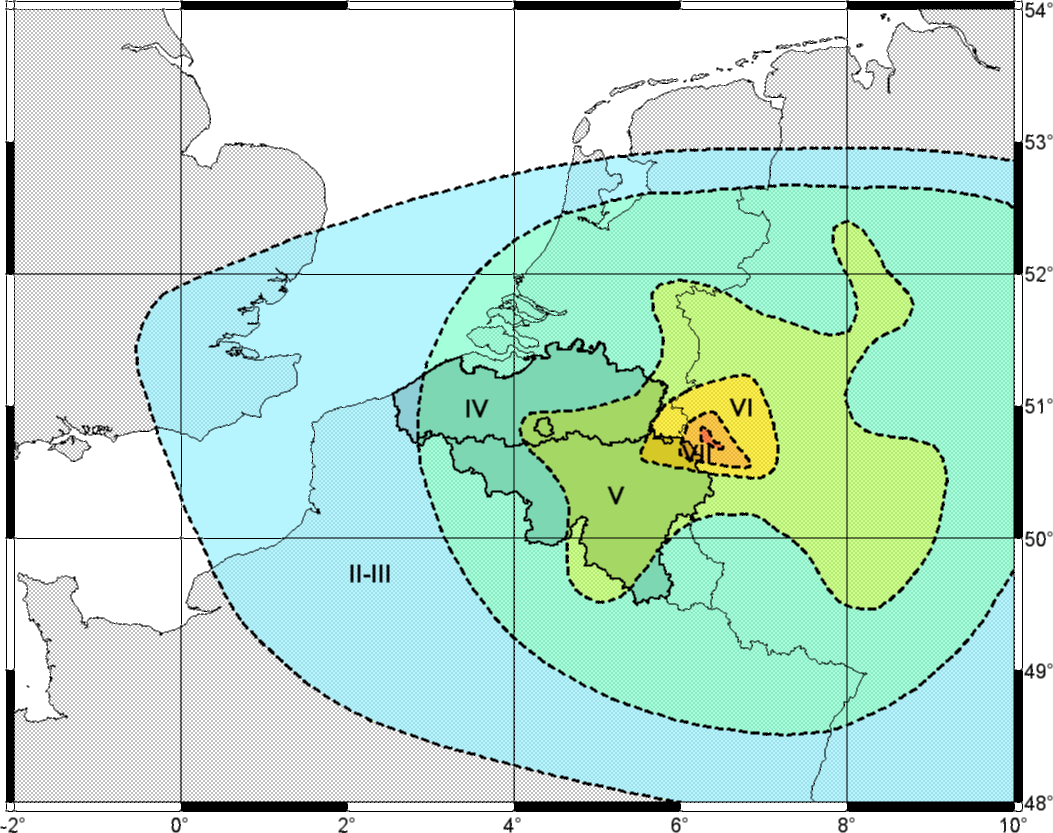
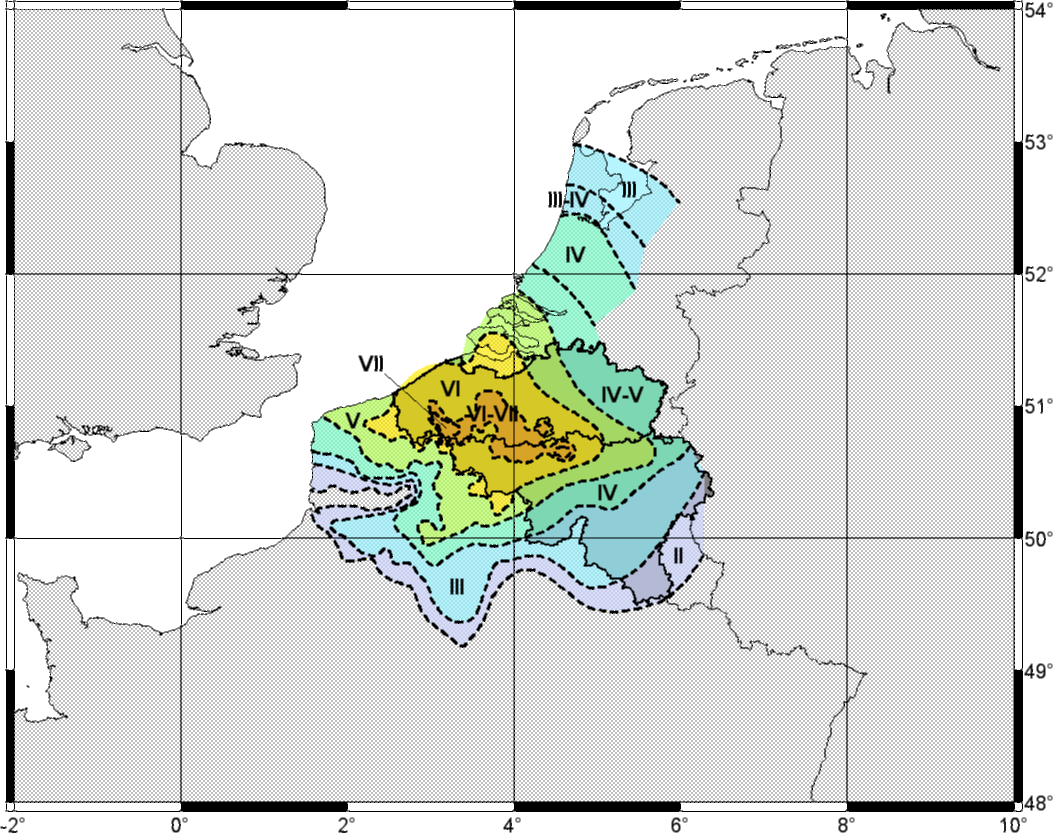
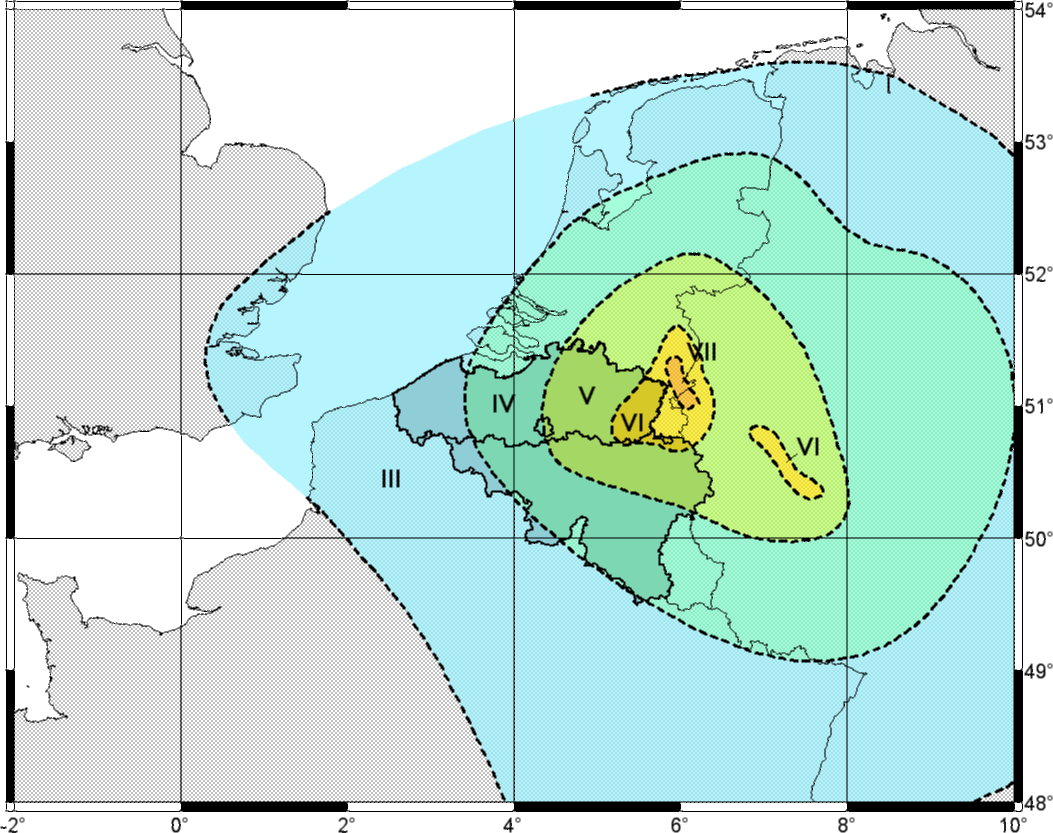
Since 1932, after every earthquake felt in Belgium, the Royal Observatory of Belgium has carried out a survey of its effects. The reports and the damage described make it possible to draw a macroseismic map showing how the intensity was distributed. On these maps, lines called isoseismals separate areas of equal intensity. Although this method predates the seismograph, macroseismic maps are a valuable complement to instrumental measurements: they give a good picture of the complex distribution of ground motion and of the type of damage, even where there are no instruments. They are also useful for earthquake engineering, because they show the most vulnerable places in a future earthquake of the same type, and they contribute to building codes.
Maps have been drawn for the following earthquakes (click on a map to enlarge it):
Magnitude
Local magnitude (Richter scale)
Intensity is a useful means of classification, but it has several shortcomings. For large earthquakes in remote areas such as deserts, or in the oceans, intensity is hard to determine. Moreover, the intensity degree does not necessarily reflect the actual size of the seismic source. This is why Richter introduced the concept of magnitude in 1935.
Magnitude is expressed as a single dimensionless number. It indicates the strength of the earthquake regardless of where it is observed. It is computed from the amplitude of the vibrations measured on seismograms and is therefore no longer subjective. Like the magnitude astronomers use for the brightness of a star, the magnitude of an earthquake follows a logarithmic scale: one more unit of magnitude corresponds to a tenfold amplitude (all other parameters being equal). Richter defined the local magnitude (ML) as:
where:
- A is the maximum amplitude measured on the seismogram, representing the maximum ground motion recorded by a seismograph at a distance Δ from the epicentre;
- A0(Δ) is the maximum amplitude for a magnitude 0 earthquake recorded at the same distance Δ from the epicentre. This term is fixed in advance and varies with the region.
For California, Richter defined a magnitude 3.0 earthquake as one that produces a displacement of 1 mm on a Wood-Anderson seismograph 100 km from the epicentre. A Wood-Anderson seismograph has a natural period of 0.8 s and magnifies ground motion about 2,800 times for waves of that period. An earthquake producing a displacement of 10 mm on this instrument therefore has a magnitude of 4.0. For other distances between the epicentre and the station, corrections are needed because of attenuation.
The local magnitude is determined from the maximum horizontal component of the ground motion caused by waves with a frequency above 1.25 Hz (a period shorter than the natural period of the Wood-Anderson seismograph). It is best suited to crustal earthquakes up to a distance of about 1,000 km. Since the reference is an earthquake at 100 km, the local magnitude would be incorrect for much more distant earthquakes.
Other magnitude scales
To compare the magnitude of all earthquakes, near or far, several scales have been derived from Richter’s. They all have the form:
where:
- A is the maximum ground motion;
- T is the period of the wave with the largest amplitude;
- F(h, Δ) is an attenuation term depending on the depth of the earthquake (h) and on the distance between the epicentre and the seismograph (Δ);
- C is a regional correction factor, determined empirically.
For teleseisms (earthquakes more than 1,000 km from the station), two scales are used:
- the surface-wave magnitude (MS), determined from the maximum amplitude of surface waves with a period of about 20 s. In large earthquakes these waves are recorded worldwide. This scale is not suitable for earthquakes with a focus deeper than 60 km, because they generate few surface waves;
- the body-wave magnitude (mb), determined from the maximum amplitude of P waves with a period of about 1 s. This scale is also suitable for deep earthquakes, but only up to an epicentral distance of 103° (about 11,000 km): beyond that begins the “shadow zone” of P waves.
All these scales saturate for the largest earthquakes: see “Seismic moment” and the moment magnitude MW.
Basic concepts
European Macroseismic Scale EMS-98
Classification system
Each intensity degree of the EMS-98 scale is defined on the basis of three criteria:
- how people perceive the shaking;
- the effects on objects and on the natural environment;
- the damage to buildings.
Buildings are classified from A to F in order of decreasing vulnerability.
Quantities are described, approximately, as:
- “a few” (0.1 to 15%);
- “many” (15 to 55%);
- “most” (more than 55%).
Five grades of damage to buildings are distinguished:
- slight damage: hair-line cracks in plaster, fall of small pieces of plaster;
- moderate damage: small cracks in walls, fall of fairly large pieces of plaster and of roof tiles, cracks in chimneys or fall of parts of chimneys;
- substantial to heavy damage: large and deep cracks in walls, fall of chimneys;
- very heavy damage: serious failure of walls, partial structural failure, collapse of inner walls;
- destruction: total or near-total collapse.
Definitions of the intensity degrees
Each degree can also include the effects of the lower degrees when these are not mentioned explicitly. Effects on the ground are dealt with separately in the text of the scale. This summary follows the core part of the scale; the official text is authoritative.
| Degree | Observed effects |
|---|---|
| I Not felt | People: Not felt, even under the most favourable circumstances. Objects and nature: No effect. Buildings: No damage. |
| II Scarcely felt | People: Felt only by very few individuals (less than 1%) at rest and in particularly receptive positions, indoors. Objects and nature: No effect. Buildings: No damage. |
| III Weak | People: Felt indoors by a few people. People at rest feel a swaying or light trembling. Objects and nature: Hanging objects swing slightly. Buildings: No damage. |
| IV Largely observed | People: Felt indoors by many people, outdoors by very few. A few people are woken up. The level of vibration is moderate and not frightening. Observers feel a slight trembling or swaying of the building, room, bed, chair, etc. Objects and nature: China, glasses, windows and doors rattle. Hanging objects swing. In a few cases light furniture visibly shakes and woodwork creaks. Buildings: No damage. |
| V Strong | People: Felt indoors by most people, outdoors by a few. A few people are frightened and run outdoors. Many sleeping people wake up. Observers feel a strong shaking or rocking of the whole building, room or furniture. Objects and nature: Hanging objects swing considerably. China and glasses clatter together. Small, top-heavy or precariously supported objects may shift or fall down. Doors and windows swing open or shut. In a few cases window panes break. Liquids oscillate and may spill from well-filled containers. Animals indoors may become uneasy. Buildings: Damage of grade 1 to a few buildings of vulnerability classes A and B. |
| VI Slightly damaging | People: Felt by most people indoors and by many outdoors. A few people lose their balance. Many people are frightened and run outdoors. Objects and nature: Small objects of ordinary stability may fall and furniture may be shifted. In a few cases dishes and glassware may break. Farm animals, even outdoors, may be frightened. Buildings: Many buildings of classes A and B: grade 1, a few grade 2; a few buildings of class C: grade 1. |
| VII Damaging | People: Most people are frightened and try to run outdoors. Many find it difficult to stand, especially on upper floors. Objects and nature: Furniture is shifted and top-heavy furniture may be overturned. Objects fall from shelves in large numbers. Water splashes from containers, tanks and pools. Buildings: Many buildings of class A: grade 3, a few grade 4. Many of class B: grade 2, a few grade 3. A few of class C: grade 2. A few of class D: grade 1. |
| VIII Heavily damaging | People: Many people find it difficult to stand, even outdoors. Objects and nature: Furniture may be overturned. Objects such as television sets fall down. Tombstones may occasionally be displaced, twisted or overturned. Waves may be seen on very soft ground. Buildings: Many buildings of class A: grade 4, a few grade 5. Many of class B: grade 3, a few grade 4. Many of class C: grade 2, a few grade 3. A few of class D: grade 2. |
| IX Destructive | People: General panic. People may be forcibly thrown to the ground. Objects and nature: Many monuments and columns fall or are twisted. Waves are seen on soft ground. Buildings: Many buildings of class A: grade 5. Many of class B: grade 4, a few grade 5. Many of class C: grade 3, a few grade 4. Many of class D: grade 2, a few grade 3. A few of class E: grade 2. |
| X Very destructive | Buildings: Most buildings of class A: grade 5. Many of class B: grade 5. Many of class C: grade 4, a few grade 5. Many of class D: grade 3, a few grade 4. Many of class E: grade 2, a few grade 3. A few of class F: grade 2. |
| XI Devastating | Buildings: Most buildings of class B: grade 5. Most of class C: grade 4, many grade 5. Many of class D: grade 4, a few grade 5. Many of class E: grade 3, a few grade 4. Many of class F: grade 2, a few grade 3. |
| XII Completely devastating | Buildings: All buildings of classes A and B and practically all of class C are destroyed. Most buildings of classes D, E and F are destroyed. The earthquake effects have reached the maximum conceivable effects. |
Find out more
- EMS-98, the page of the scale on the GFZ (Potsdam) website, with versions in other languages
- Grünthal, G. (ed.), European Macroseismic Scale 1998, Council of Europe, Luxembourg, 1998: doi:10.2312/EMS-98
- Short form of the EMS-98 scale
How does a relative gravimeter work?
In a relative gravimeter, the displacement of a suspended mass is proportional to the variations of g.
Fundamentally, these instruments are very similar to seismometers. They simply observe the motion of the mass hanging from the spring in a much lower frequency band, that is, at much longer periods: from a minute to several months. This requires suspension systems that are very stable over time, which are very difficult to build. Most of them are portable instruments for field measurements.
Relative gravimeters do not give the value of gravity directly, but since they are very sensitive to its variations, they can accurately map the difference in gravity relative to a reference point.
Spring gravimeters (a known mass pulls more or less on a spring whose extension is measured) reach a precision of 10−8 m·s−2 (about 10−9 g).
Superconducting gravimeters (a metal sphere levitated by a magnetic field) are even more precise, of the order of 10−9 m·s−2 (about 10−10 g): see “How does a superconducting gravimeter work?”.
How does a seismometer work?
Introduction
The seismometer is the first link in the chain that measures seismic waves. Its role is to convert ground motion into a proportional electrical voltage, which is recorded by an acquisition system.
Ground motion is characterised by its velocity and its acceleration. A seismometer can therefore be seen as a velocity-to-voltage or acceleration-to-voltage transducer, acceleration being simply the time derivative of velocity.
A seismometer, or geophone, is basically a mechanical system. There are also so-called electronic seismometers: these are in fact mechanical seismometers whose output signal is processed electronically before being passed to the acquisition system. This processing greatly improves the characteristics of the simple mechanical geophone.
Types of seismometers
An earthquake results from internal forces that cause the rock to break. These ruptures generate waves that propagate through the Earth and that we feel as shaking. Seismologists study these waves, which span a wide range of frequencies, from 1 mHz to 100 Hz, that is, periods from 0.01 s to 1,000 s (Table 1). Since a seismometer measures only part of this range, seismometers are classified by the frequencies they cover.
| Period (s) | Source of the ground motion |
|---|---|
| 0.01 | industrial vibrations |
| 0.1 | industrial noise and nearby explosions |
| 1 | distant explosions and very near earthquakes |
| 10 | P and S body waves of earthquakes, permanent natural microseismic noise |
| 100 | direct surface waves (Rayleigh and Love) |
| 1,000 | indirect surface waves (mantle waves) |
| > 1,000 | free oscillations of the Earth |
Table 1: frequency range of ground motion
There are two main categories of seismometers: short-period seismometers, sensitive to frequencies above 1 Hz (periods shorter than 1 s), and long-period or broadband seismometers, which are also sensitive to frequencies below 1 Hz.
A short-period seismometer with a bandwidth of 1 Hz to 80 Hz thus complements a broadband seismometer covering the range from 0.0028 Hz (360 s) to 50 Hz.
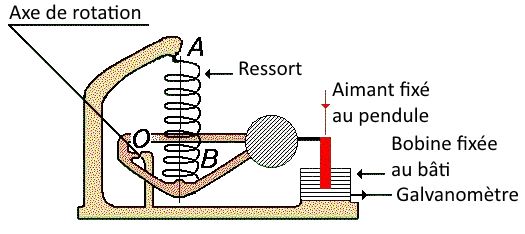
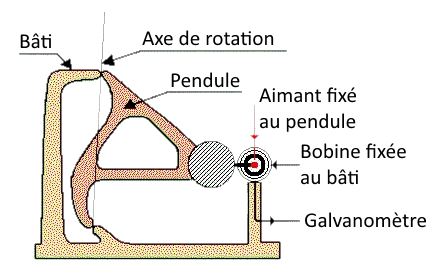
A distinction is also made between vertical (Figure 1a) and horizontal (Figure 1b) seismometers. The former measures motion along the vertical, the axis through the centre of the Earth; the latter measures motion in a horizontal direction, perpendicular to that axis.
Operating principle
Take a vertical seismometer. It consists of a mass suspended by springs inside a case. The mass carries a winding of wire, a coil, while the case carries a magnet. The assembly is built so that the coil can move in the magnetic field of the magnet (Figure 1c).
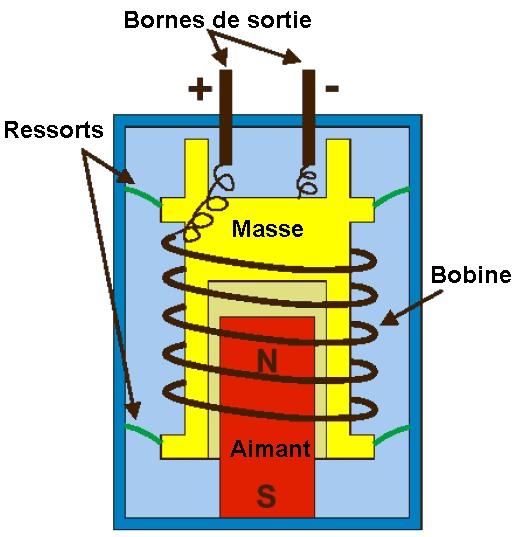
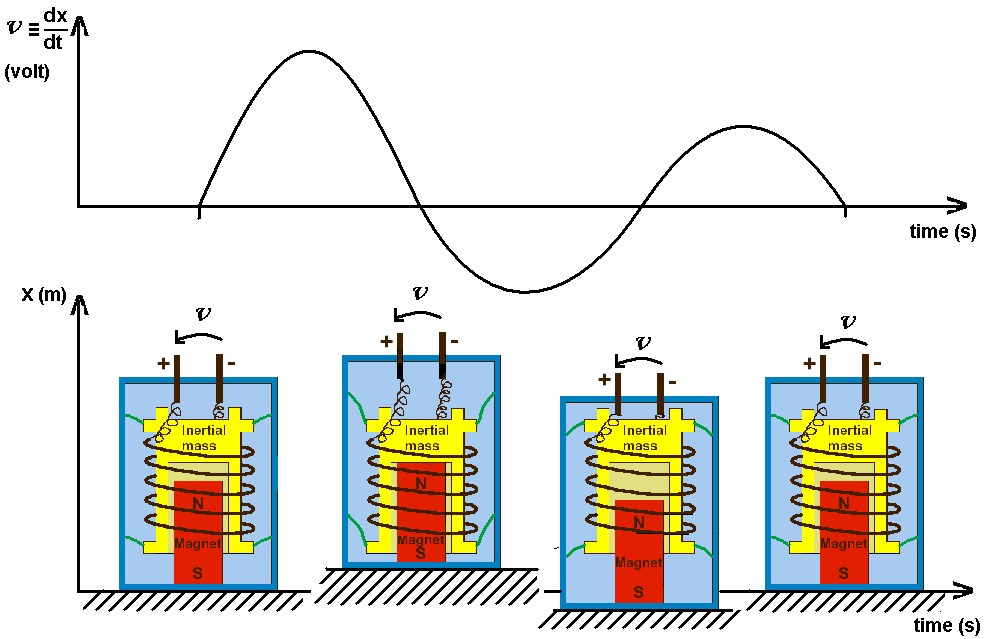
During an earthquake, the case follows the ground motion, while the mass, because of its inertia and elastic suspension, tends to stay still. The coil then sees the magnetic field moving around it. The voltage across the coil is proportional to the velocity of this motion; since the field moves with the velocity of the ground, we obtain a ground-velocity-to-voltage transducer (Figure 2).
This system obviously has its limits, both mechanical (mass, spring stiffness and damping) and electrical (coil, magnet).
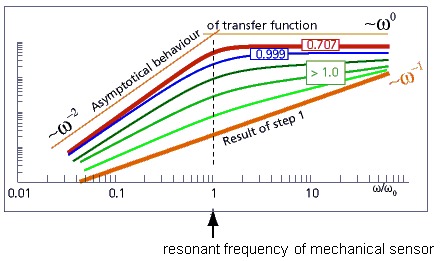
For slow motion, at frequencies below the natural frequency of the mass-spring system, the mass no longer stays still: it follows the case, and therefore the ground, and the output voltage becomes very small. This sets the lowest frequency the seismometer can measure.
For very fast motion, the response is limited by spurious resonances of the suspension and by the inductance of the coil. This sets the highest measurable frequency.
Characteristics
The main characteristics of a seismometer are: its lower and upper corner frequencies; its transduction factor G (in V/(m/s)); and its damping coefficient ζ (dimensionless).
The lower and upper corner frequencies define the frequency range the seismometer can measure.
The transduction factor relates the measured voltage to the corresponding ground velocity. Expressed in volts per unit of velocity, the larger it is, the weaker the ground motion the seismometer can measure.
The damping coefficient determines how the seismometer responds to the different frequencies of ground motion. The aim is a coefficient close to 0.707, the best compromise between a flat frequency response, a high transduction factor and a low lower corner frequency (Figure 3).
Calibration
For a mechanical seismometer, calibration consists in determining its intrinsic characteristics: natural frequency, damping and transduction factor. Once these are known, the behaviour of the seismometer can be adjusted as needed (for example to a damping coefficient of 0.707), from a simple resistor at the sensor output to an electronic feedback system.
For an electronic seismometer, one cannot speak of intrinsic characteristics, since an electronic circuit is an integral part of the instrument and already modifies its characteristics.
Documentation
A poster (PDF, in French) describes the whole chain for measuring ground motion.
How does a superconducting gravimeter work?
Despite the care taken in manufacturing the spring, the calibration factor of relative spring gravimeters usually varies over time, and their measurements drift strongly.
This is why the Observatory installed a superconducting gravimeter at the Membach station (PDF, in French), near Eupen, in 1995. A second superconducting gravimeter was installed at Rochefort at the end of 2014 (KARAG project).
In this instrument, the spring suspension is replaced by the magnetic levitation of a sphere, produced by persistent currents flowing in two coils. The whole assembly, made superconducting and kept at −269 °C, is very stable: it measures the variations of g over time a hundred times more precisely than conventional spring gravimeters, with a very small long-term drift.
Unlike spring gravimeters, however, the superconducting gravimeter cannot be moved. Its measurements can be followed live: see real-time g variations.
How does an absolute gravimeter work?
An absolute gravimeter directly measures the strength of gravity.
The principle generally consists in observing the fall of a mass in a vacuum: the time it takes to travel a given distance directly gives the value of g.
The FG5 absolute gravimeter thus observes the free fall of a corner-cube reflector that is dropped many times. This test mass travels 20 cm in 0.2 seconds in a vacuum chamber. It is surrounded by a cart that follows it as it falls, to avoid drag from residual air molecules; a motor drives this cart, lifts the mass back up and controls the drops.
The position of the mass is measured by laser interferometry. One arm of a Mach-Zehnder interferometer, the test beam, is sent to the falling reflector, which returns it to another reflector suspended from a long-period seismometer (natural period of about 60 s) that provides an inertial reference. The test beam is then recombined with the other beam, the reference beam. As the mass falls, it produces interference fringes that are detected by an avalanche photodiode and timed by a rubidium atomic clock. The length standard is an iodine-stabilised helium-neon laser: absolute gravity measurements are therefore tied directly to the SI units of length and time.
Laboratories are also developing cold-atom gravimeters, which measure the trajectory of atoms in free fall.
Radiated energy
The seismic moment of an earthquake is also proportional to the energy released in the form of seismic waves:
where:
- μ is the shear modulus (or modulus of rigidity), about 3 × 10¹⁰ N·m−2;
- Δσ is the stress drop on the fault plane during the earthquake, usually about 30 bar, or 3 × 10⁶ Pa.
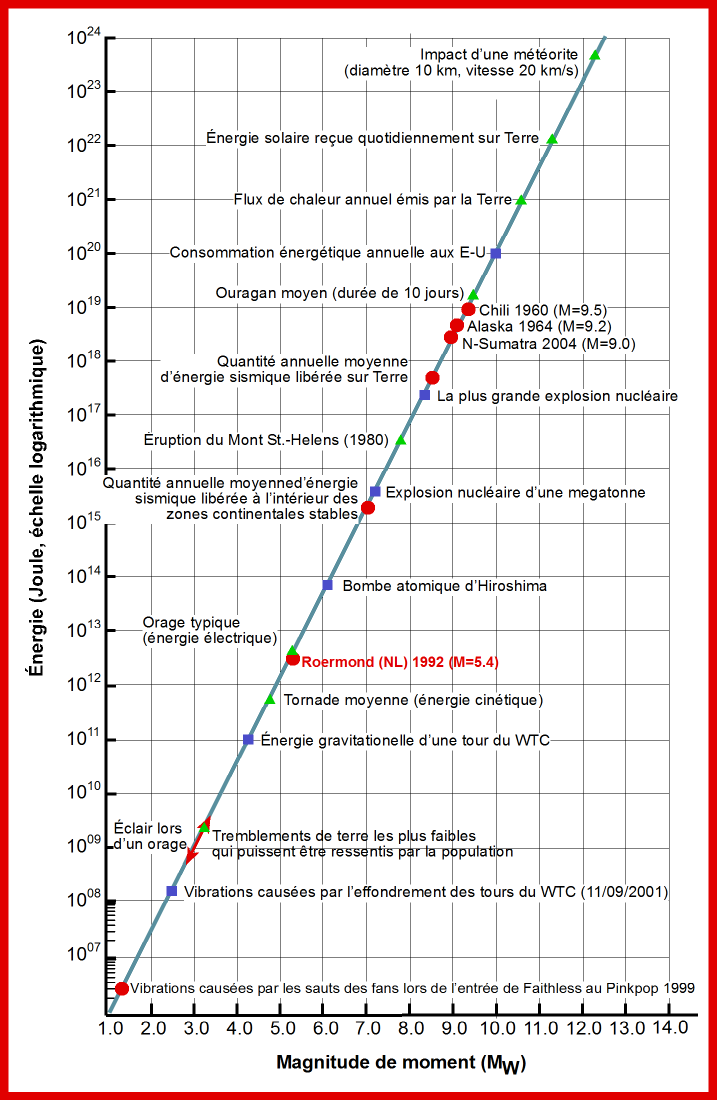
To a first approximation, the radiated energy therefore increases, like the seismic moment, by a factor of about 32 per unit of magnitude. An earthquake of moment magnitude 7.0 thus releases nearly 1,000 times more energy than an earthquake of magnitude 5.0.
The graph below shows the relation between moment magnitude and seismic energy, compared with the energy of other natural and man-made phenomena. For example, the energy released when a mass of one tonne falls from a height of 100 m is comparable to that of a magnitude 1 earthquake.
Seismic moment
Each of the magnitude scales described under “Magnitude” has its limitations. These scales are also subject to saturation: above a certain value, the magnitude obtained is too low. This limit lies around 6 for the local magnitude and the body-wave magnitude; the surface-wave magnitude saturates from about 7.5.
The most suitable physical parameter for describing the “size” of an earthquake is the seismic moment, introduced by Aki in 1966. It is directly related to the dimensions of the seismic source:
where:
- μ is the rigidity of the medium, that is, of the Earth’s crust in the focal area (about 3 × 10¹⁰ N·m−2);
- L and W are the length and width of the rupture area, the part of the fault that slipped during the earthquake; the length is measured along the strike of the fault, the width down its dip;
- D is the average displacement of the two blocks along the fault.
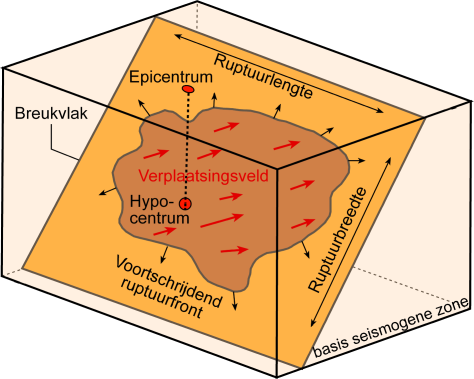
Parameters of the seismic source
The seismic moment is expressed in N·m. It is computed from seismograms and, for large earthquakes, can also be determined independently from geodetic or geological evidence of surface deformation.
To overcome the limitations of the existing magnitude scales, Kanamori introduced a new scale based on the seismic moment in 1977. The moment magnitude is computed with a logarithmic formula that gives, for smaller earthquakes, values consistent with the other scales:
with M0 in N·m. One more unit of magnitude corresponds to a seismic moment about 32 times larger. Unlike the other scales, the moment magnitude is also suitable for the largest earthquakes, without saturation. See also “Radiated energy”.
Seismic waves: what are they?
The rupture of rock, the slip along the fault, generates waves that propagate through the medium around the source.
Seismic waves are elastic waves: they pass through a medium without changing it permanently. The initial impulse “pushes” particles, which in turn push the neighbouring particles and then return to their place, and so on. The vibrations produced by an earthquake spread in all directions. Their velocity and amplitude are changed by the geological structures they cross, so the recorded signals combine effects of the source, of the media crossed and of the measuring instruments. Seismic waves travel through the whole globe and tell us about its make-up.
There are two main families of waves.
Body waves travel through the interior of the Earth. Their velocity depends on the material and generally increases with depth. There are two types:
- compressional waves, or P waves (primary or longitudinal waves). As they pass, the ground undergoes successive expansions and compressions, parallel to the direction of propagation. They are the fastest (about 6 km/s near the surface) and arrive first on a seismogram;
- shear waves, or S waves (secondary or transverse waves). As they pass, the ground moves perpendicular to the direction of propagation. They do not travel through liquids: in particular, they are stopped by the Earth’s liquid outer core. Slower than P waves, they arrive second on seismograms.
Body waves travel somewhat like light: they can be reflected or refracted, that is, deflected, at every change of medium, for example between the mantle and the core. They can therefore follow very complex paths through the Earth and do not all arrive at the same place at the same time.
Surface waves are guided by the Earth’s surface. Their effect is reminiscent of ripples on the surface of a lake. They are slower than body waves, but their amplitude is generally larger. We distinguish:
- the Love wave: the ground moves as for an S wave, but without vertical motion. This horizontal shaking causes a lot of damage to building foundations;
- the Rayleigh wave: the motion, both horizontal and vertical, is elliptical, a little like that of a speck of dust carried by a wave.
Love waves travel at about 4 km/s: they are faster than Rayleigh waves.
Short form of the EMS-98 scale
The short form of the European Macroseismic Scale, extracted from its core part, is intended to give a very simplified and generalised view of the EMS. It can, for example, be used for educational purposes. This short form is not suitable for assigning intensities: for that, see the full EMS-98 scale.
| EMS intensity | Definition | Description of typical observed effects (abstracted) |
|---|---|---|
| I | Not felt | Not felt. |
| II | Scarcely felt | Felt only by very few individual people at rest in houses. |
| III | Weak | Felt indoors by a few people. People at rest feel a swaying or light trembling. |
| IV | Largely observed | Felt indoors by many people, outdoors by very few. A few people are woken up. Windows, doors and dishes rattle. |
| V | Strong | Felt indoors by most, outdoors by few. Many sleeping people wake up. A few are frightened. Buildings tremble throughout. Hanging objects swing considerably. Small objects are shifted. Doors and windows swing open or shut. |
| VI | Slightly damaging | Many people are frightened and run outdoors. Some objects fall. Many houses suffer slight non-structural damage like hair-line cracks and fall of small pieces of plaster. |
| VII | Damaging | Most people are frightened and run outdoors. Furniture is shifted and objects fall from shelves in large numbers. Many well-built ordinary buildings suffer moderate damage: small cracks in walls, fall of plaster, parts of chimneys fall down; older buildings may show large cracks in walls and failure of fill-in walls. |
| VIII | Heavily damaging | Many people find it difficult to stand. Many houses have large cracks in walls. A few well-built ordinary buildings show serious failure of walls, while weak older structures may collapse. |
| IX | Destructive | General panic. Many weak constructions collapse. Even well-built ordinary buildings show very heavy damage: serious failure of walls and partial structural failure. |
| X | Very destructive | Many ordinary well-built buildings collapse. |
| XI | Devastating | Most ordinary well-built buildings collapse, even some with good earthquake-resistant design are destroyed. |
| XII | Completely devastating | Almost all buildings are destroyed. |
Source: short form of the EMS-98, see the page of the scale on the GFZ website.
Subduction zones
A subduction zone is an area where a tectonic plate, usually an oceanic one, sinks into the Earth’s mantle beneath another plate, which may be continental or oceanic.
Subduction zones are found mainly around the Pacific Ocean, but also in the Mediterranean, where the African plate sinks beneath the Eurasian plate.
The largest earthquakes occur in these subduction zones. For example, the earthquake of 11 March 2011 off the east coast of Honshu, Japan (magnitude MW 9.0), caused a tsunami that claimed a great many victims.
To find out more about subduction and subduction volcanism (in French): see Vulcania.
The internal structure of the Earth
Since the end of the 19th century, seismometers have been installed all around the Earth. During large earthquakes, such as the San Francisco earthquake of 1906, the waves emitted could be recorded by all the instruments. Studying these recordings showed seismologists that the Earth is not a homogeneous ball: it is more like a fruit, with a solid seed at its centre (the inner core), surrounded by a liquid outer core, all wrapped in a solid mantle that deforms slowly, itself topped by the crust. Seismologists were also able to determine the thickness of this crust, which differs under the continents and under the oceans.
To find out more about the waves that made these discoveries possible, see “Seismic waves: what are they?”.
What is an earthquake?
An earthquake is, at its origin, a sudden slip between two parts of the Earth’s crust along a fault. The place where the slip starts is called the focus, or hypocentre; the point on the surface directly above it is the epicentre. This movement takes place at depth, often a few kilometres down, but it can reach a few hundred kilometres in subduction zones.
Depending on the depth of the focus, seismologists distinguish:
- shallow earthquakes, less than 60 km deep;
- intermediate earthquakes, from 60 to 300 km;
- deep earthquakes, from 300 to 700 km (there are none deeper).
Earthquakes do not usually occur alone. They are sometimes preceded by small earthquakes called foreshocks, and are often followed, for days, weeks or months, by other earthquakes that can be significant: the aftershocks.
What is gravimetry?
Gravimetry is the science of measuring gravity (g) and its variations in time and space.
g depends, among other things, on:
- latitude;
- the distribution of masses inside the Earth;
- the rotation of the Earth (speed and position of the axis of rotation);
- the seasons (variations in the amount of water in the ground);
- the relative position of the Moon and the Sun, which produce the tidal forces.
The relative or absolute measurement of g is essential in several fields of scientific research:
- in geophysics, gravity variations are measured to study tectonic deformation, post-glacial rebound, Earth tides, the influence of the atmosphere and hydrosphere, and the structure of the globe from the inner core to the crust;
- in geology, the analysis of local variations of g has many applications, in particular for validating models of the subsurface;
- in metrology, g is involved in realising units that depend on mass (such as force and pressure) and played a key role in the new definition of the kilogram;
- finally, in geodesy, g is essential for determining the geoid, and hence heights. The geoid represents mean sea level and its extension under the continents: it is the reference surface for computing heights.
See also the Gravimetry page in the Research section.
What is gravity?
The force of gravity, which defines the weight of an object, keeps us on the surface of the Earth and makes bodies near its surface fall. This force is proportional to mass:
where m is the mass of the body and the acceleration due to gravity. The magnitude of this acceleration is gravity g, measured with a gravimeter.
It is a physical quantity that varies in time and space: see “What is gravimetry?”.
To find out more: the poster La mesure de la pesanteur (PDF, in French).
What is seismology?
Seismology is the science that studies earthquakes and their consequences. It has several branches:
- instrumental seismology, which measures ground motion and detects, locates and studies earthquakes worldwide. It extends to the study of plate motion, of the stresses between plates, of the nature of their boundaries and of the geometry of faults within the plates;
- historical seismology, which searches old documents, and also architectural heritage, for accounts and traces of past earthquakes. A poster (PDF, in French) presents the Observatory’s work in this field;
- palaeoseismology, which studies very old earthquakes from the traces they have left in the landscape or in the ground.
Knowledge of present and past earthquakes makes it possible to delineate hazard zones and to anticipate the consequences of an earthquake in a given region: this is how the seismic zoning map of Belgium was drawn up.
Since the beginning of the 20th century, by studying the waves recorded by seismometers, seismologists have been able to determine the internal structure of the Earth.
To find out more:
- a poster on the history of instrumental seismology on the IRIS website;
- the posters of the Royal Observatory of Belgium on the various aspects of seismology.
Further reading
- USGS (United States Geological Survey): educational resources on earthquakes
- IRIS (Incorporated Research Institutions for Seismology): animations and teaching resources
- ASNR (French Nuclear Safety and Radiation Protection Authority, formerly IRSN): taking seismic risk into account for nuclear facilities, in French
- Quand la terre tremble, “C’est pas sorcier”, French-language science magazine (video)